Real-time Insights Dashboard
The Real-time Insights dashboard shows detailed metrics on your customers, how your site loads, and errors that may be slowing your site down. Use this dashboard to confirm that Yottaa has installed correctly, and to see data before it becomes available on other dashboards.
By default, the dashboard includes data for the past 24 hours. To change the time period, click ![]() in the upper-right corner of the page.
in the upper-right corner of the page.
The dashboard includes the following graphs and metrics:
|
Example |
Metric |
Definition |
|---|---|---|
|
|
Data Detected |
If this box is not checked, free Shopify App Store Edition was not properly installed. Contact merchantsupport@yottaa.com for assistance. |
|
|
Site Optimized |
This box is only checked if you have updated to full Shopify App Store Edition and optimized your site. |
|
|
Page Views by Device |
Shows how many times shoppers viewed your pages from desktop, mobile devices, and tablets. |
|
|
Resources Loaded Per Page |
Resources include HTML, CSS, JS, photos, videos, and third parties. The more resources, the slower and more inconsistently your pages will load. |
|
|
First Input Delay |
The amount of time a shopper has to wait for the site to respond to user input due to any event interrupting the application logic. |
|
|
Largest Contentful Paint |
The moment when the main content of your page has rendered on the screen for users. This metric does not measure when the content becomes interactive (for Chrome users only). |
|
|
Cumulative Layout Shift |
How much the content of the page unexpectedly shifts while users are viewing it. |
|
|
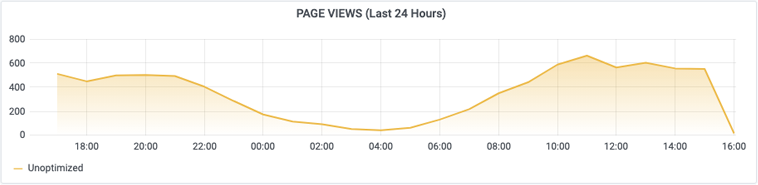
Page Views (Last Hour) and Page Views (Last 24 Hours) |
These two graphs show the number of times that shoppers have viewed your site's pages over the past hour and over the past 24 hours. You can adjust the time period of the second graph by clicking |
|
|
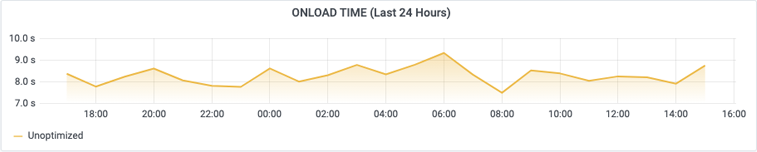
Onload Time (Last Hour) and Onload Time (Last 24 Hours) |
Onload time measures the time it takes for the initial HTML document to load with all stylesheets, images, and subframes. At this point, the page is usually interactive to users.
You can adjust the time period of the second graph by clicking |
|
|
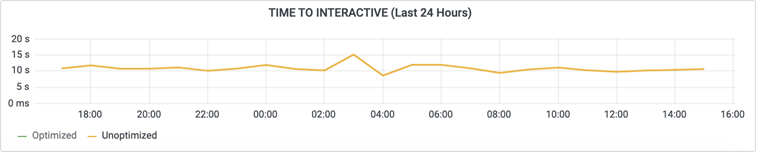
Time to Interactive (Last Hour) and Time to Interactive (Last 24 Hours) |
A different way to measure the time at which the page becomes interactive to users. Yottaa measures using request timings to determine when the browser has paused loading resources. This metric is useful for sites that have delayed the loading of most third parties until after onload.
You can adjust the time period of the second graph by clicking |